



Evil Charts
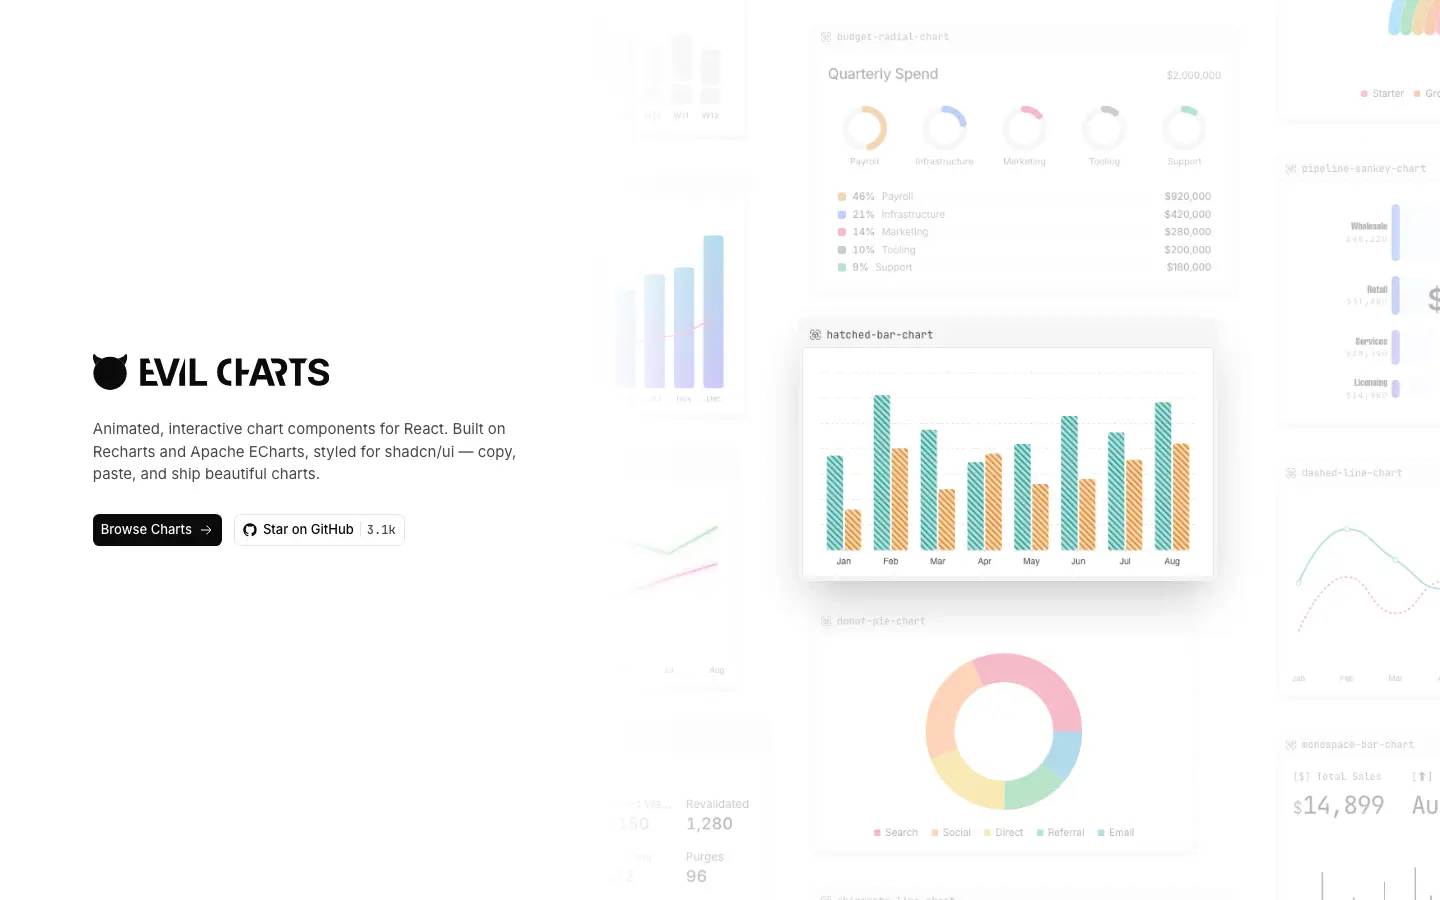
Free, open-source animated React chart components built with Recharts, Apache ECharts, shadcn/ui, and Tailwind CSS. Copy, paste, and ship beautiful charts.
Evil Charts is an open-source set of animated chart components for React, built on Recharts and Apache ECharts and styled to sit inside shadcn/ui projects. Its creator, a design engineer at Axiom, started it because most products ship a chart library's defaults, so every area, bar, radar, pie, radial and Sankey chart comes with deliberate motion, tooltips and legends. Open it when a dashboard's charts need to look designed rather than generated.
- Type
- Library
- Category
- shadcn registries, Component libraries, Animated components, Charts & data viz
- Patterns
- Data Visualization
- Added
- Sep 19, 2026
- People
- Gurbinder